Astronomers face the staggering challenge of mapping the universe—a cosmos so vast that even light, the fastest traveler we know, takes billions of years to cross it. To make sense of this enormity, scientists employ clever techniques that combine light, mathematics, and technology into a kind of cosmic cartography. Unlike maps of Earth, these star charts are not flat depictions of land and sea but multidimensional models of space, time, and motion. Every new survey adds detail to humanity’s evolving portrait of the universe, showing not only where galaxies are but how they have moved, collided, and expanded.
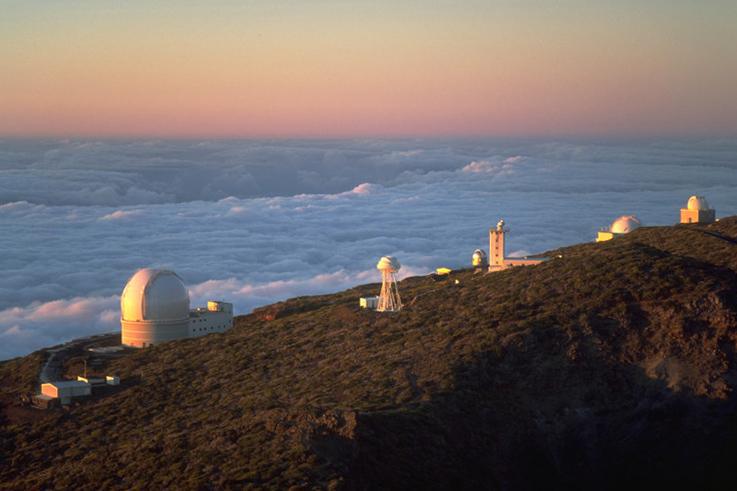
The starting point for any cosmic map is light. Telescopes, whether mounted on mountaintops or orbiting in space, act as the eyes of astronomy. They collect photons that have traveled across unimaginable distances, sometimes originating before our planet even formed. Each photon carries information about the star, galaxy, or quasar it left behind, and when astronomers piece them together, they reveal both the location and the history of those celestial objects.
But simply spotting stars is not enough. Distances must be measured, and that is far trickier than it sounds. For nearby stars, astronomers use parallax, the apparent shift of a star against background constellations as Earth orbits the Sun. This geometric trick allows for precise distance measurements within a few thousand light-years. Beyond that, astronomers need more indirect methods, which is where “standard candles” like Cepheid variables and Type Ia supernovae come into play.
A standard candle is a cosmic lightbulb whose intrinsic brightness is well known. By comparing its true brightness with how dim it appears from Earth, astronomers can calculate its distance. This method has been a cornerstone of mapping since the early 20th century, and it underpins our modern understanding of the size of the universe. Edwin Hubble’s discovery that galaxies were racing away from us, leading to the concept of an expanding universe, was built on these techniques.
For truly vast scales, redshift becomes the dominant tool. When light from distant galaxies stretches as the universe expands, it shifts toward the red end of the spectrum. The greater the redshift, the further away the galaxy. By carefully measuring redshifts, astronomers create three-dimensional maps that chart not just positions, but also the dynamic expansion of space itself.
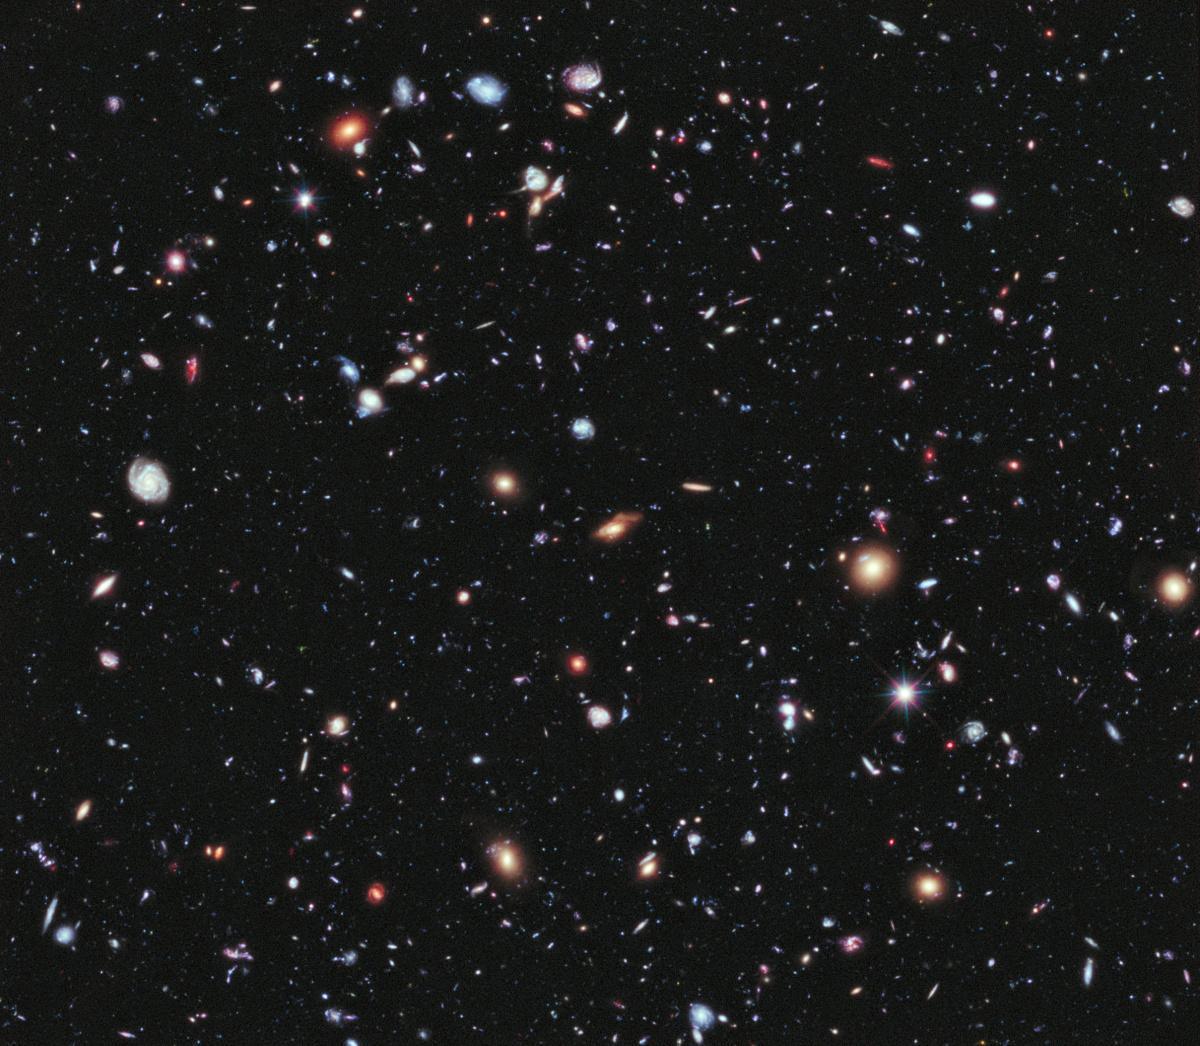
These maps reveal structures on cosmic scales that are almost architectural. Galaxies cluster into filaments and walls, leaving immense voids in between. The resulting “cosmic web” resembles a vast sponge or a neural network, with matter strung out in delicate threads across the universe. Surveys like the Sloan Digital Sky Survey (SDSS) have charted millions of galaxies, turning abstract data into breathtaking visualizations of this grand design.
Technology pushes the accuracy of these maps further each decade. Radio telescopes can probe neutral hydrogen gas, infrared observatories peer through cosmic dust, and gravitational wave detectors now add an entirely new layer of data about the most violent events in the universe. The European Space Agency’s Gaia mission, for example, has catalogued precise positions and motions of over a billion stars in our own galaxy, giving us a map not only of where the stars are but where they’re going.
Mapping the universe is not just about position—it is also about time. Because light takes time to travel, the farther away we look, the further back in history we see. Thus, a cosmic map doubles as a time machine, showing the early universe, middle-aged galaxies, and present-day structures all at once. Astronomers stitch these eras together to understand how the cosmos has evolved over 13.8 billion years.
This act of charting is inherently collaborative and cumulative. No single telescope can capture the whole picture; instead, data is layered across decades of research and international cooperation. Every wavelength—from gamma rays to radio waves—adds its own dimension to the map. In this way, the universe is not so much drawn as woven, each dataset threading into the next.
There’s a philosophical dimension, too. To map the universe is to place humanity within it, giving us both perspective and humility. Our solar system occupies a quiet corner of an ordinary galaxy, one dot among billions. And yet, through ingenuity and mathematics, we have managed to sketch the outlines of the infinite.
The work is ongoing and, by its nature, never complete. As telescopes grow sharper and more ambitious—such as the James Webb Space Telescope and next-generation observatories—astronomers will keep refining their maps. Each refinement offers more than accuracy; it offers new questions, new mysteries, and new directions for exploration. The universe is not static, and neither are our maps of it.
In the end, mapping the universe is both science and art: part mathematics, part imagination, and part devotion to the grand task of situating ourselves in the cosmos. It is cartography at the largest possible scale, a human attempt to capture the contours of everything. And though the map will always be unfinished, each generation draws the lines a little further, reaching into the darkness to trace what was once invisible.


